Showing posts with label by president. Show all posts

Saturday, November 10, 2007

Economic Performance by President Charts Up

Long promised charts displaying the economic performance in the post-war years by president are up at the DemandSide.net

No wonder they chose the color red.
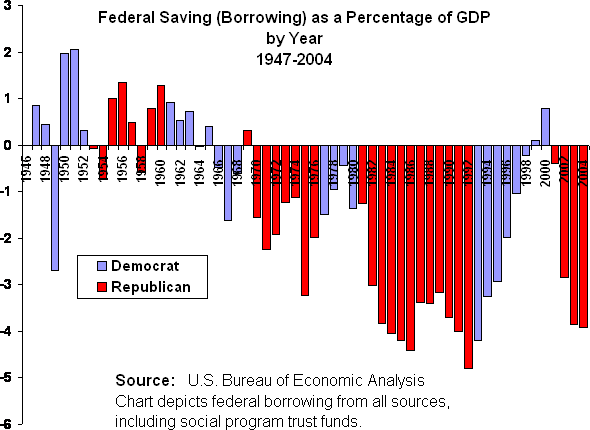
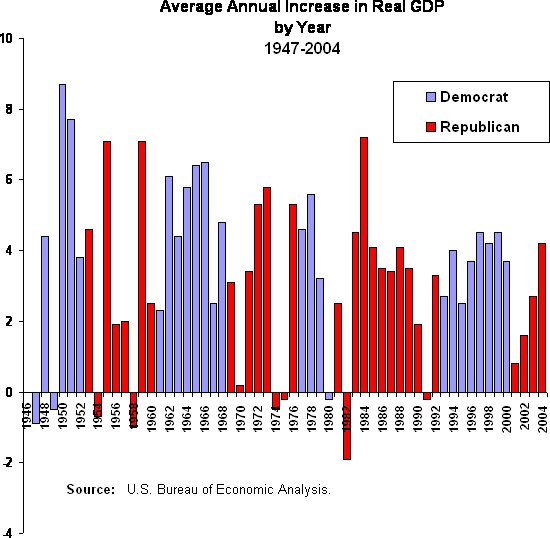
Borrowing is higher, employment and investment lower under Republicans. Or if you prefer the more positive, Democrats have been good for employment, investment and fiscal responsibility.

There are the charts by president for borrowing, employment, unemployment, net real GDP, real GDP, investment and corporate profits. Charts by year (not included this month) show the consistent improvement of the economy under Democrats and the volatile nature of the measures under Republicans. That's for next year, or the book.

Sunday, October 28, 2007

Economic Performance by President

The economy has done better under Democrats. Surprised?

To be completely upfront, it is not our contention that Democrats have exercised a superior economic theory to achieve these results. While the theory may be better, it is more likely a function of the fact that Democrats have supported a broad constituency, Republicans have supported a narrower constituency, and the economy does better the broader the support.

The first chart, employment growth, is simply the average annual percentage growth in the number of jobs in the non-farm economy. The most interesting thing about this, to us, is that the weak job growth under Bush II has not translated into a corresponding rise in the official unemployment rate. (See sidebar.) This is because the participation rate, the denominator in the unemployment rate calculation, has been shrinking.

Shrinkage can occur from several causes, more people choosing college than the job market, retirement of workers, or workers dropped into the black hole called "discouraged workers." The last category comprises those who have given up looking. The unemployment rate counts only those who are actively looking for work. Another category which began to grow in the 1990s is the disabled, with a marked increase in people applying for Social Security Disability.

The second chart, growth in net real GDP, displays a measure that takes into account the federal deficit, including that amount borrowed from the entitlement trust funds -- Social Security and Medicare. Net Real GDP subtracts government borrowing from GDP. If deficits are justified as a stimulant to the economy, priming the pump, as it were, it makes no sense to count the amount used to prime as a product of the pump. Deficits are not a product of the current economy, they are a borrowing from the future economy.
It probably does not surprise you, sadly, that politicians for all their alarm about the fate of Social Security and Medicare have been moving money from these entitlements into the operating budget as fast as it is deposited. Thus, when the baby boomers reach for their social security checks, the operating side of the federal budget will have to start borrowing more or taxing more.
A final note: An expanded look at these and other measures of economic performance by president will be up on the web site in two weeks. Tomorrow on the podcast, we'll be looking at the measure of GDP itself. What does it measure? What are the weaknesses? Are there other measures?

Tuesday, January 10, 2006

No wonder they chose the color red

"Political business cycle" was a term used to describe the ginning up of the economy just prior to a presidential election. The data in these charts describes another political business cycle.


Manipulating the economy for political ends was a technique, perhaps not first, but best developed by Richard Nixon. He blamed the recession of 1959-60 for his loss to Kennedy, and gone to school on it. When he got in office, with a compliant Fed, he made sure good economic news greeted voters on election morning.

Subsequently, Ronald Reagan erased the memory of the most desperate recession in postwar history (1981) with some good economic news in 1983-84. Never mind the debt we are still paying off. George Bush I did not get the response from Alan Greenspan he needed, and thus not the bump he needed.

Jimmy Carter was perhaps the worst player, since he backed off expansionary policies out of fears for inflation, suffered a slowdown in the last year of his first term, and did not see a second. Clinton was surely aware of the phenomenon. He didn't need to do much but crow in 1996, but in 2000, he made a calculated and unprecedented move to release stockpiles from the strategic petroleum reserve to cut energy prices in the year running up to the election. I still think if Gore had run on the economy, he would have won, instead of running on ... morals? Well, whatever he ran on.

The following charts have nothing to do with that. These simply describe the behavior of GDP and budget under the administration of the two parties. "Net GDP" is my formulation to show what the economy would have done without the borrowing. GDP is more a function of demand than supply, and when you increase demand by borrowing, GDP loses its usefulness in describing the health of the economy. Nobody is going to say credit cards are the same thing as paychecks.

If you want to get the full discussion, you'll have to buy the book. But this is what happens to GDP when you subtract the borrowing (or add surpluses), including the borrowing from Social Security and other social programs.


Note to W: Borrowing massive amounts of money because you cut taxes on the rich does not lead to economic strength.

Monday, December 5, 2005

The economy is doing great. Right. Look out the window.

Dubya trotted out into the Rose Garden the other day so he could get one number on the nightly newscasts: 4.6% GDP growth in the previous six month period (annual rate). He bubbled a little bit, muttered something about keeping taxes down, and retired (don’t we wish) to the spin room.

Look out the window. It's still raining. And Dubya’s poll numbers on the economy show America isn’t listening anymore.

Before I show you my secret chart on GDP, let it be known that it’s jobs that matter. Check out the Economic Policy Institute’s work on this. Jobs Picture shows a pathetic 2.6% more jobs four years into the current “recovery,” jobs which cost us $860 billion in tax cuts. The next lowest performance over a similar period is 7.6% in the 1990s, after taxes were raised. EPI’s The Boom that Wasn’t will depress you even further.

[At this point I begin a long digression on why jobs matter more than GDP and how we used to do better. For the sake of flow, I’ve saved it for a sunny day.]

GDP can be spun in a lot of ways. It can be bought by trucking Chinese goods halfway across the country, past closed factories and abandoned storefronts into the WalMart at the edge of town. Jobs can’t.

GDP can be generated by borrowing against our future, shifting spending to us today from us tomorrow. You can do the same thing with a credit card. Borrowing is not earning. Are you feeling good when you borrow five percent of your income so you can buy three percent more stuff?

So, now, the following chart needs some explanation.

First, it should be titled “Average Annual Real GDP Growth,” instead of just “Average Real GDP Growth.” It shows average growth per year.

Second, the concept is to produce GDP net of borrowing, that is, taking our spending (GDP) and deducting federal deficits, what we put on the credit card. Surely if we’re priming the pump we can’t count the water we put in as part of the product.

Lastly, the deficits used as the minus are not the deficits of the unified budget that you most often see. I have used the deficits of the operating budget. This leaves social security out of the financing of general government.

Explanation of this last point: Social Security is a retirement benefits program that is operated very well and is financed by payroll taxes. Tax revenue goes into a trust fund for future use. The trust fund buys only special federal bonds. If social security were a private or independent program obeying the same rules, the government could not count the receipts from the bonds it against its operating shortfalls. For some reason, in the “unified” budget, this is allowed. The reason, of course, is so the numbers won't look as bad as they are. I don’t allow the theft in the chart below. This is simply growth minus federal debt.

These data go through 2004. They would be roughly the same today, however, since the pace of borrowing has only picked up.